Feature statistics across intervals
| < PREVIOUS: Feature vectors | > NEXT: Syllable features |
|
|
|
|
Until now we have only presented instantaneous feature values: either features at the mouse cursor pointer, or vectors of features over an interval. However, it is often desired to examine the distribution of features using simple first and second order statistics, so as to summarize the acoustic structure by calculating first and second order statistics, such as means and variance. This can be used to characterize natural sound units (notes, syllables, motifs, bouts) or just to look at the overall distribution of features over many sounds.
First select the 'Feature statistics across interval' tab. Then, to outline an interval, either click on the sonogram in two places, or click and drag. Click & Drag will automatically add record, whereas clicking in two positions must be followed by clicking 'Add record' to add data to the table:
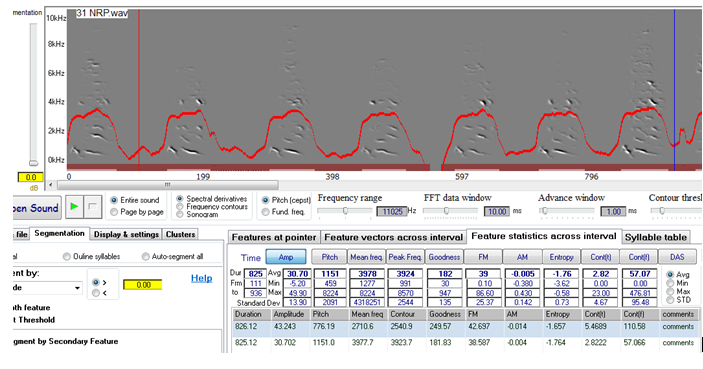
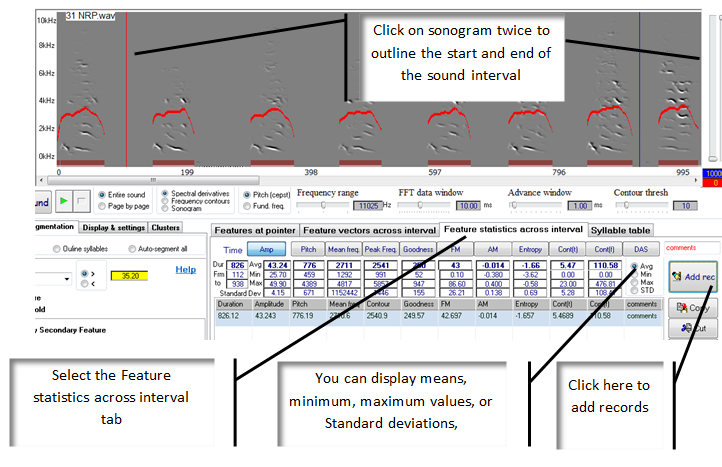 The feature distribution of the introductory notes we outlined is now summarized in our record (bottom of the image above). Important: Although we outlined an interval containing both sounds and silences, only features of the sounds are included in the calculation of the features statistics. If we now change the segmentation criteria, to include silences as shown below, the feature statistics would change:
 -
We can now test how features of the introductory notes might differ than those of the song motifs that the bird sings immediately after them:
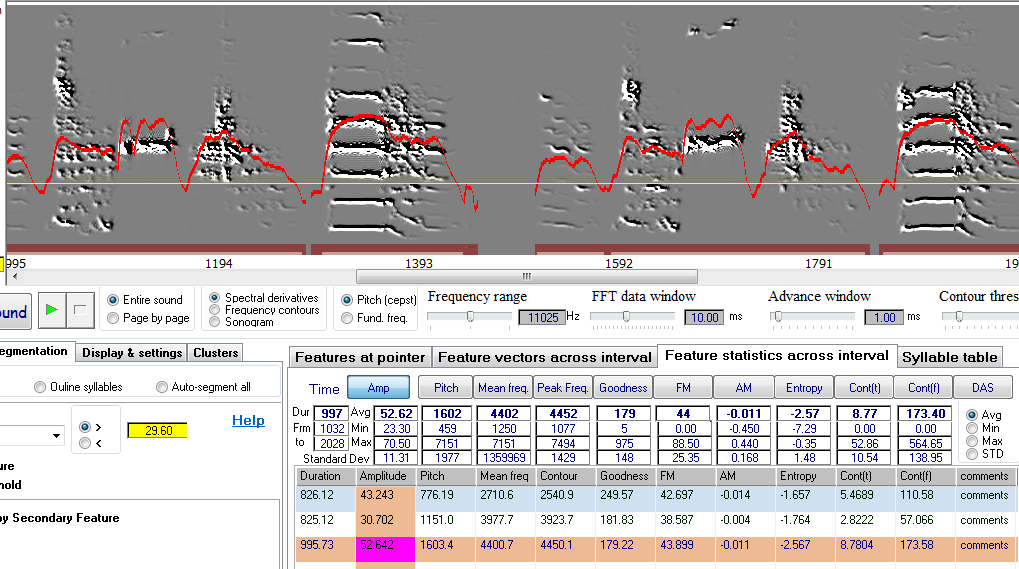 -
As shown, mean feature values now look very different, with higher amplitude, higher pitch, lower Wiener entropy, etc.
|
|