Feature space
| < PREVIOUS: Saving animal & file info | > NEXT: Chapter 6 |
|
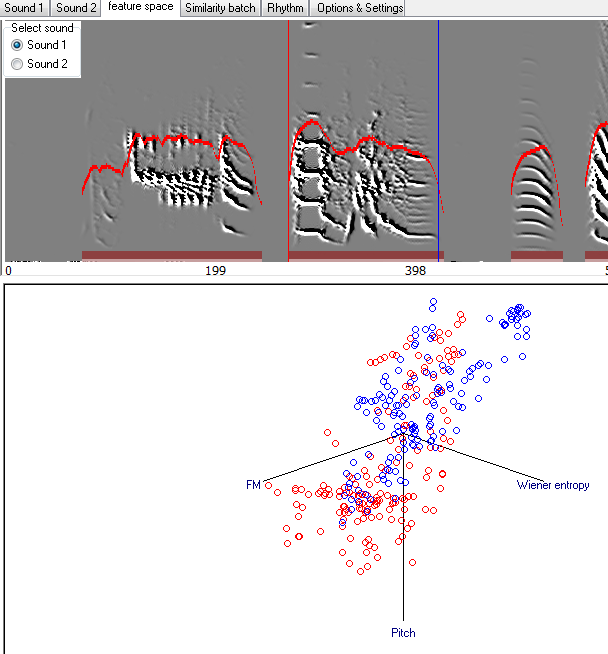
Feature space is a simple graphical method for viewing the distribution of features within and across sounds. As simple as it is, it can be quite useful. For example, you can compare features between two call types, and also judge if over time there is any directional changes in sound features. Here is a little demonstration of how it can be used: open SAP2011 Explore & Score and open a sound file that include several syllables. Let's start with the sound Example 2. Click on the 'feature space' tab, outline the first syllable and select 'draw' in the popup menu: 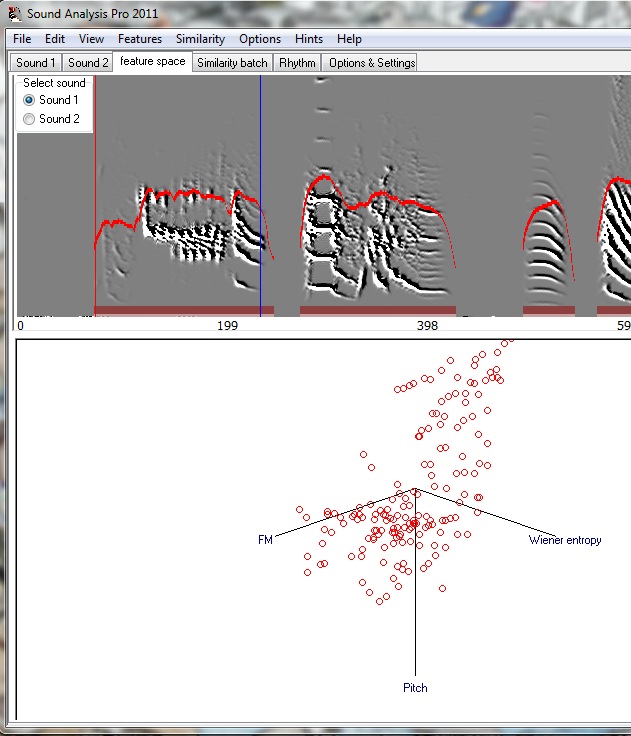 Next, outline the second syllable, but this time select 'pick color & draw'. Select blue, and the outcome should look like this:
 Now rotate the image and pan it with the mouse to try to obtain a better separation of the colors:
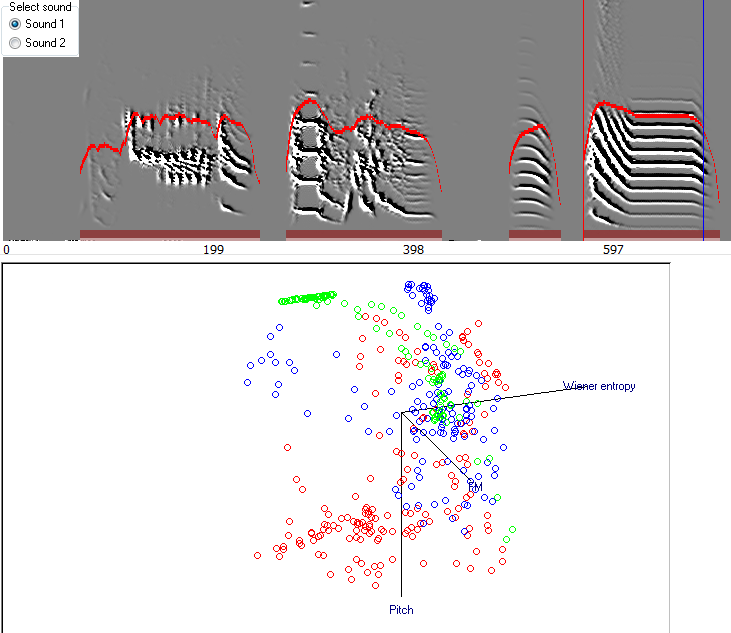
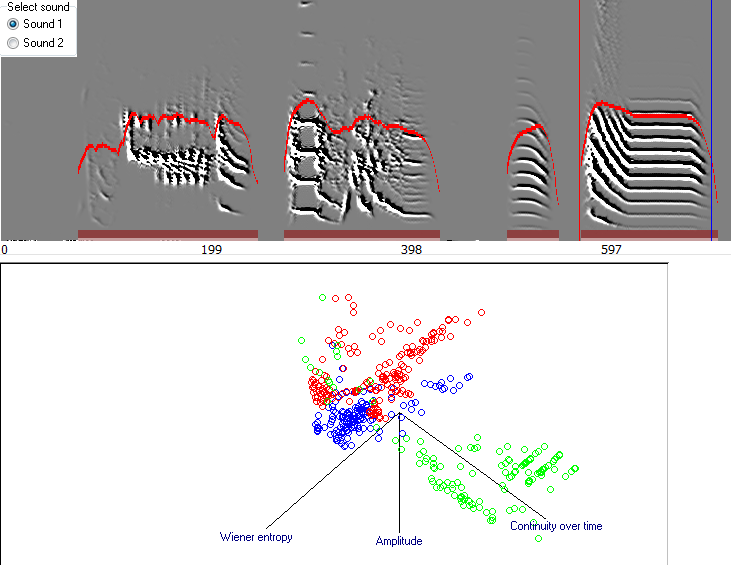
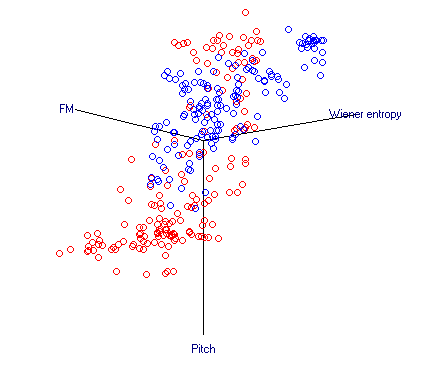 Clearly, the two syllables differ in pitch and in Wiener entropy, but less different in FM. Now, outline syllable syllable 3, select Green and Draw:
 What is this exercise good for? Well, it is a way of examining the emergence of categories of sounds in a continuous space. For example, if you suspect that ‘Dee’ notes of two populations of chickadees are distinct – you may examine the data in feature space. Outline each note type and use a color code to distinguish between the populations. Select several examples from each population and see how it looks like before you get yourself committed into heavy quantitative analysis.
Last trick: clear the image and use different features, and outline the sounds again, e.g.:
 |
|