Exploring song features
| < PREVIOUS: Intro to Explore & Score | > NEXT: Feature vectors |
|
|
|
|
Almost everything that SAP2011 does is based on the features presented in chapter 4, including segmentation and charectarization of syllable structure, similarity measurements, clustering of syllables to type, Dynamic Vocal Development (DVD) maps, etc.
Here we present a few methods for exploring feature, viewing them using various methods and saving them. SAP2011 provides several ways of looking at features. Graphically, you can look at feature curves on the sonograms, or look at feature scatter plots in 3D. Numerically, you can look at features values at certain time events, or look at feature time series over an interval of sound, or look at features first and second order statistics of song syllables or of intervals of sounds.
The simplest way of observing features is by clicking on a feature button, e.g., Wiener entropy, look at its curve on the sonogram, and observe the numerical value (using the "features at pointer" tab) as shown below:
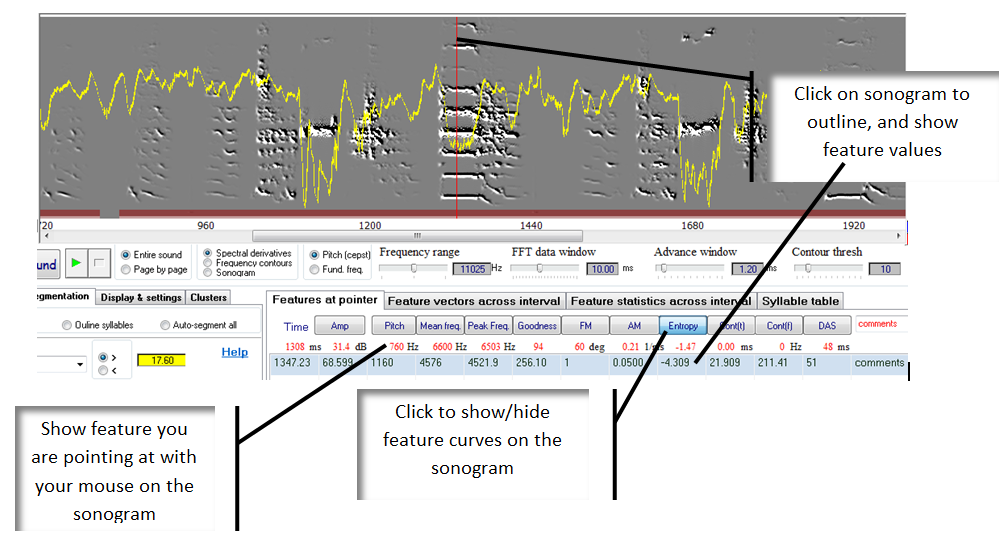 -
you can then click on the feature data rows, to see the location of each feature value on the sonogram.
Writing comments is also advisable -- do it before you click on the sonogram.
|
|