|
|
| < PREVIOUS: Articulation based analysis |
> NEXT: Amplitude |
|
|
Viewing the song features
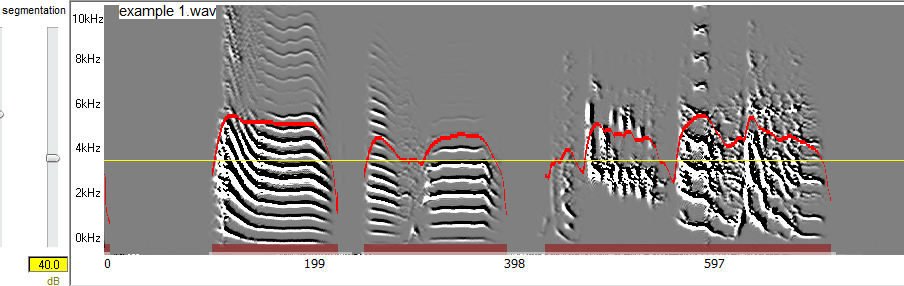
SAP2011 allows you to visualize features both graphically and numerically as shown below ( see also video tutorial). In Explore & Score, open sound 'example 1' and set segmentation amplitude threshold to 40.0 as shown below:
-
-
-
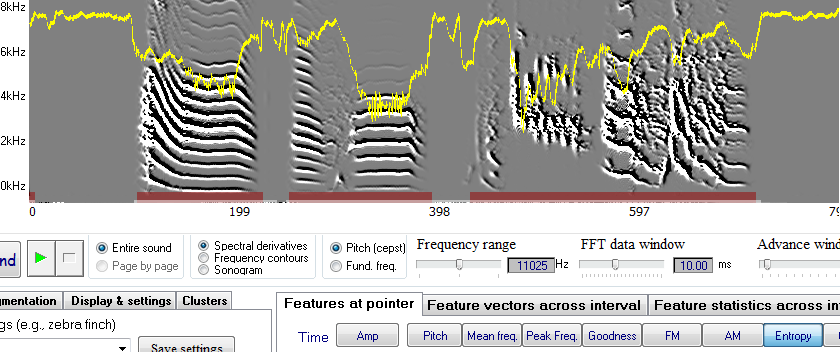
The thin yellow line represents the amplitude threshold, and the red curve is the amplitude. The brass color outlines represent syllable boundaries as defined by the threshold. To see graphs of other features, select the 'features at pointer' tab, and click on the features buttons one by one, while observing the sonogram image:
-
-
-
-
Just below those buttons you will see numbers that represent the feature values at the location of the pointer. Move the pointer around the spectral image and observe the changing values of pitch, FM, as well as song time and frequency at the current pointer position. Clicking on the sonogram saves the feature values into the table below. Clicking on the saved values will show a red outline at the location of each feature that you saved.
|
|