Developmental histograms
| < PREVIOUS: Introduction to DVD maps | > NEXT: 2-D DVD maps |
|
|
|
|
One-dimensional DVD-maps display changes in the values of a single feature, capturing the entire table (e.g., the whole song development) in a single image. Petr Janata was the first to suggest this idea, and showed that presenting the evolution of duration histograms during development has traceable structure. The plot shows the distribution of syllable durations during any one day in each raw using gray-scale and the entire matrix span that entire song development. SAP2011 uses a similar approach, except that the gray-scale is replaced by a 3D reconstruction. Open SAP2011 DVD-map module, Click the '1D developmental histograms' tab and open the table of syll_R109. Click the start button, and wait several seconds: This is a developmental histogram of syllable durations. Each row in the 3D histogram shown below represents a single day of song development, and the height of the mountains represents the abundance (frequency) of a certain duration. The far side of the histogram represents the end of song development, and the 3 peaks stand for the 3 syllable types produced by this bird. As shown, it is very easy to trace the peaks backwards to the point of origin. The advantage of this representation is that it shows us the entire song development at a glance, based on the entire song development data. It is also making it obvious why is it so important to record and analyze the entire song development data - otherwise, computing such histograms won't be as robust and won't work on a short time scale. Note how one of the peaks 'takes a turn' during early song development (this is the vocal change of time-warping). You can see that the vocal change occurs within a few days, whereas thereafter, duration did not change much. As we shall discuss later on, vocal changes are often like this - they can take a few hours, a few days or several days, and then nothing happens during the next several days. Given this hectic nature of vocal change, DVD-maps give us an easy way of detecting critical moments in song development.
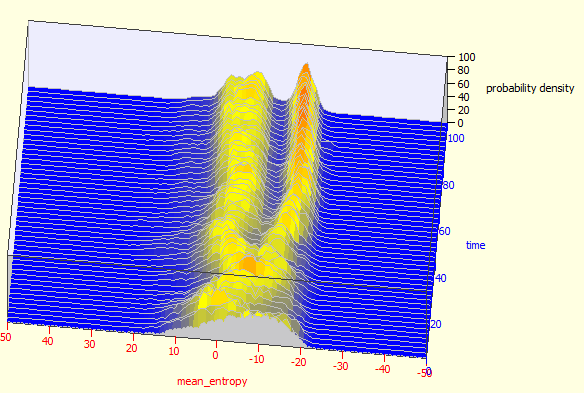
Finally, histograms can be computed for any features, here are a few examples: Wiener entropy developmental histogram shows an early bifurcation:
 Use the mouse to rotate the image, and the sliders of the left to change display contrast and color scale:
 Here is goodness-of-pitch histogram, note that the changes in this feature occur much later in development:
 and here is FM-histogram, again showing a very different time course of vocal changes:
 The range can be automatic or manual. When selecting a manual scale the minimum and maximum range is set by the user. The number of bins, however, is fixed and equals 100, so selecting a duration range of 0-500ms will give bins of 5ms. If you choose auto-scale, SA+ will scale the features based on the normalization of syllable features (see in options -> feature normalization).
Aliasing issues: never let the bin-size approach the encoding accuracy of a feature. The likely problem is with duration. The actual encoding is the window-step taken, which is about 1.4ms by default. Since we use 100 bins, the default definition is about 5ms when the range is set between 0-500ms. Setting it from, say 50-300ms is taking us down to 2.5ms - which is still fine, but going down to, say, 100-200 is taking us down to 1ms - which is below the critical (Nyquist) value - which will result in aliasing: a nasty, unresolvable artifact in the duration histogram.
|
|

