Feature vectors
| < PREVIOUS: Exploring song features | > NEXT: Feature statistics across intervals |
|
|
|
|
Viewing and saving feature time series is very easy in SAP2011: click on the 'feature vector' tab, and then click the beginning and end of a sound interval to outline it. Then click the 'add features' button as shown below: 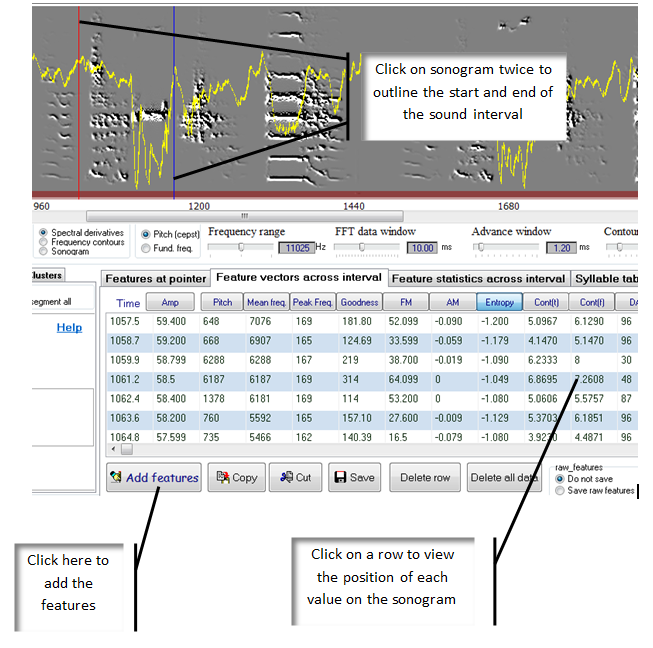 In the tabular list each record (line) represent features calculated for each FFT window within the sound interval you outlined. For example, setting 'FFT window' to 10ms and 'advance window' to 1ms, each record is of features calculated in time windows 1-10ms, 2-11ms, 3-12ms, etc. That is, for every one millisecond in time windows of 10 ms. Therefore, the curves of feature value you can see on the sonogram is presented here as a vector. You can copy it and paste it to Excel, or save it as an XML file and open it in Matlab.
|
|